
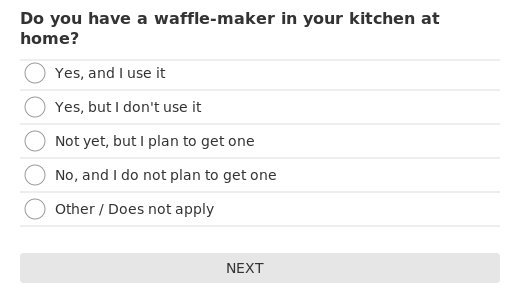
Do you have a waffle maker at home? According to a CivicScience survey of nearly 1,400 U.S. adults, 44% of Americans do. About half of those owners—23% of all respondents—say they actually use it, while 21% admit they have one but don’t use it. Meanwhile, 16% plan to get one eventually, leaving 41% with no waffle maker and no plans to acquire one. This reveals waffle makers’ unique position in American kitchens: they’re appealing enough that nearly half of Americans acquire them, yet challenging enough that 21% of owners admit they don’t actually use theirs.
The age breakdown isn’t quite what you might expect. Young adults 18–29 (45%) and seniors 65+ (47%) lead the pack, while the middle—30–44 (44%) and 45–64 (37%)—lag behind a bit. The result is a U-shaped curve: waffle makers are popular with those setting up their first kitchens and with older Americans who’ve collected gadgets over the years, but they tend to skip over the busy middle decades.
Gender doesn’t make much of a difference—men and women report nearly identical ownership (43% each)—and the regional numbers are just as tight: South (44%), West (44%), Northeast (42%), Midwest (41%). Clearly, this isn’t a breakfast habit bound by geography or tradition.
Regional preferences paint a surprisingly uniform picture across the United States. The South leads slightly with 44% ownership, while the Northeast (42%), Midwest (41%), and West (44%) cluster tightly together. This geographic consistency indicates that waffle maker appeal isn’t driven by regional breakfast traditions or cultural preferences, but rather represents a broadly American kitchen phenomenon.
Waffle maker ownership connects with several lifestyle and consumption patterns that reveal deeper insights about kitchen priorities and daily routines. The relationship with convenience store shopping habits proves particularly telling. Among waffle maker owners, shopping frequency spreads fairly evenly: 34% shop convenience stores at least weekly, 16% every few weeks, 12% several times yearly, and 39% rarely or never. However, those without waffle makers show markedly different patterns—only 14% frequent convenience stores weekly, while 46% rarely or never shop there. This suggests waffle maker owners may lead busier, more convenience-oriented lifestyles despite investing in home breakfast equipment.
Pet ownership reveals another unexpected connection. Both waffle maker owners and non-owners show similar pet preferences, but slight differences emerge. Among those with waffle makers, 55% own dogs while 45% own cats. Non-owners show marginally higher dog preference at 59% versus 41% for cats. While the differences are modest, they might reflect lifestyle factors that influence both pet choices and kitchen appliance investments.
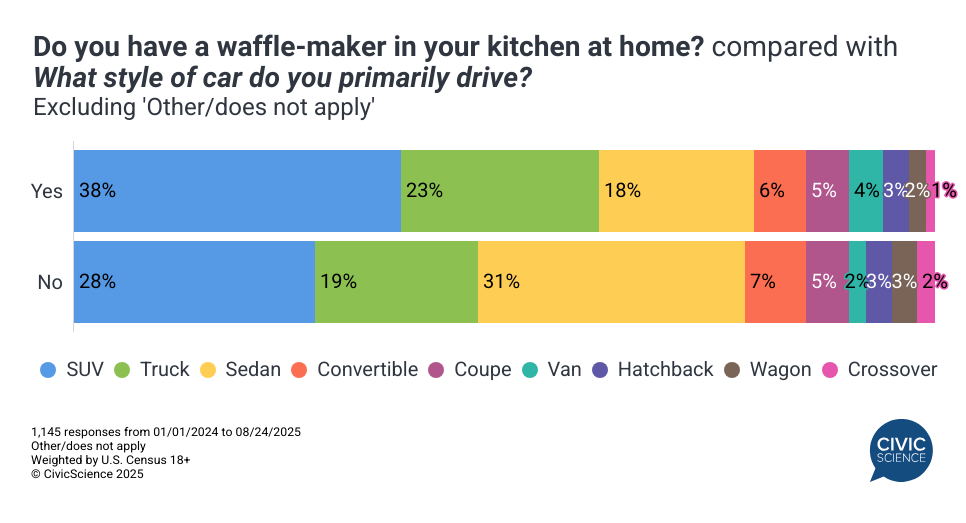
Vehicle preferences provide the most striking correlation with waffle maker ownership. Those who own waffle makers favor SUVs at 38% compared to just 28% among non-owners. Conversely, non-owners prefer sedans at 31% versus waffle makers owners’ 18%. Truck preferences also differ notably—23% of waffle maker owners drive trucks compared to 19% of non-owners. This vehicle preference gap suggests waffle maker owners may lead more suburban, family-oriented lifestyles that prioritize both larger vehicles and specialized kitchen equipment.
Musical tastes further illuminate the waffle maker divide. Rock/classic rock dominates among both groups but more strongly among waffle maker owners (47% versus 51% for non-owners). Country music shows the reverse pattern—25% of waffle maker owners prefer country compared to just 19% of non-owners. Pop and hip-hop preferences remain relatively similar across both groups, suggesting that while musical tastes correlate with waffle maker ownership, the differences reflect broader lifestyle orientations rather than generational divides.
Despite their mixed usage, waffle makers have quietly carved out a place in American kitchens. They aren’t tied to one age group, region, or household type—they simply sit there, waiting for the right moment.
Love taking polls? Sign up to participate in the Poll of the Day here.
This article’s data comes solely from CivicScience’s database, which contains nearly 700,000 poll questions and 5 billion consumer insights.
Related Content: