With St. Patrick’s Day approaching, many Americans are preparing to celebrate—whether that means parades, festive drinks, or simply wearing something green. According to CivicScience data, 40% of U.S. adults say they plan to wear green on St. Patrick’s Day this year, showing that the tradition remains a popular way to mark the holiday.
Interest in wearing green is strongest among Gen Z, Millennials, and Gen X, each hovering around 41%-42%, saying they plan to wear the festive color. Baby Boomers under-index compared to younger groups. Men are more than 10 points more likely than women to say they’ll wear green, and city residents are far more likely than those living in suburban or rural areas to join the tradition. Regionally, participation is fairly consistent across the country, except in the Northeast, where residents are slightly less likely to say they’ll wear green.
But demographics aren’t the only thing separating those who plan to wear green from those who don’t. CivicScience data reveal several notable differences between the two groups:
-
Sleep Habits: While relatively few Americans report sleeping fewer than four hours a night, those planning to wear green are nearly twice as likely to say they usually get that little sleep. Meanwhile, those not planning to wear green are slightly more likely to report getting more than six hours of sleep.
-
Love of Cooking: Those wearing green are over 10 points more likely to say they love cooking (27% vs. 16%).
-
Auto Insurance: They’re also more interested in switching auto insurance providers, with 11% saying they’re very likely to switch in the near future, compared to 6% of those not wearing green.
-
Ad Relevance: Those planning to wear green are three times more likely to say that most of the ads they see online are very relevant to their interests (18% vs. 6%).
-
Brand vs. Price: Green-wearers tend to have stronger opinions when it comes to brand versus price, over-indexing at both ends of the spectrum, while those not wearing green are more likely to say brand and price are equally important.
-
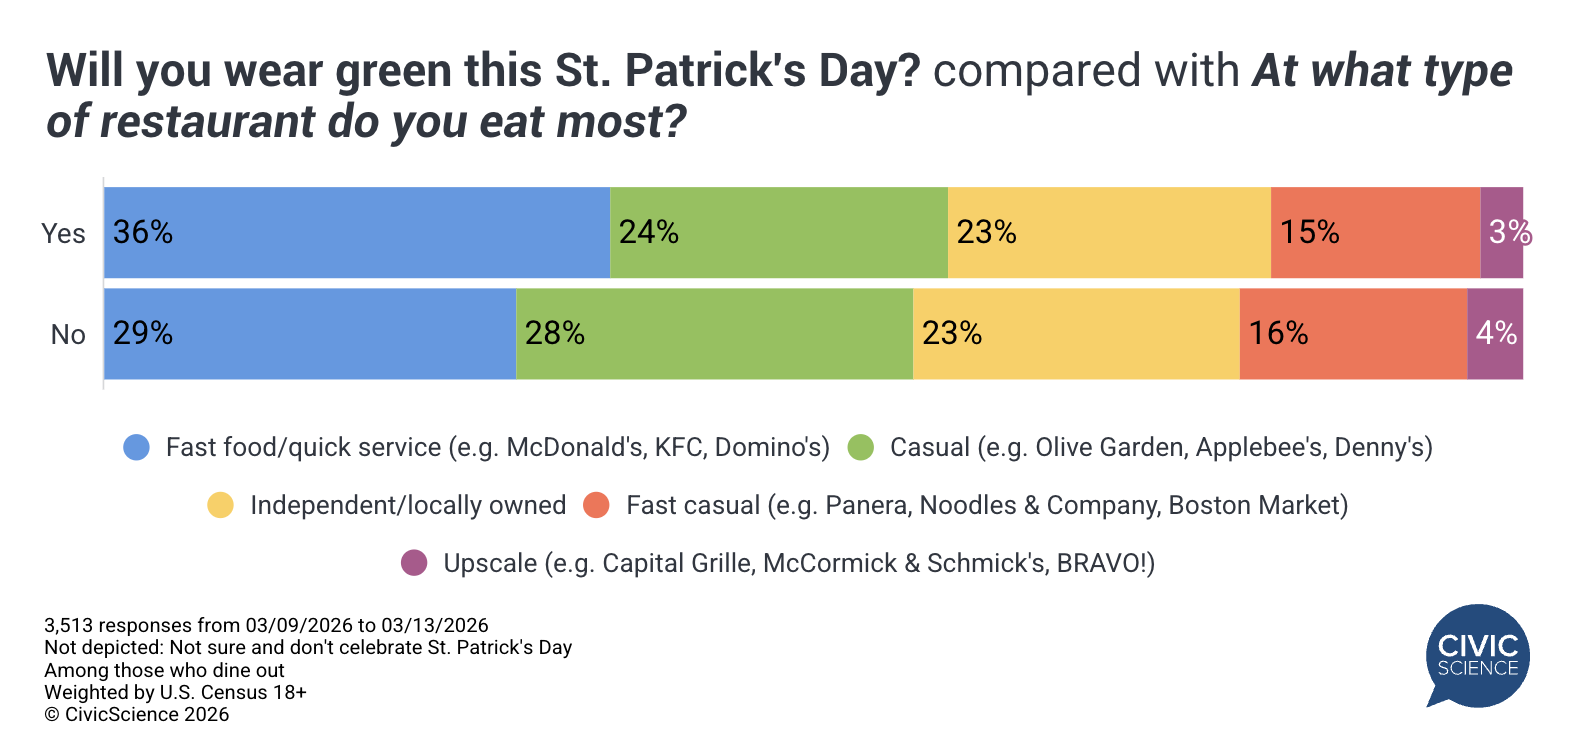
Dining Preferences: Among those who eat out, people planning to wear green are seven points more likely to say they most often eat at fast-food restaurants, while those not wearing green lean more toward casual dining establishments.
Whether it’s for tradition, fun, or simply getting into the spirit of the holiday, wearing green remains a simple but widely shared way for Americans to celebrate St. Patrick’s Day, especially among younger adults and city dwellers.
Love taking polls? Sign up to participate in the Poll of the Day here.
This article’s data comes solely from CivicScience’s database, which contains nearly 700,000 poll questions and 5 billion consumer insights.