With winter well underway, now is the time of the year when many turn to hearty bowls of soup to warm up on a cold evening. And among classic options, chili remains a perennial favorite for those looking to fill up and warm up with the same spoonful. However, as with all classics, chili recipes vary–specifically with their inclusion or exclusion of beans.
Currently, CivicScience data show 66% of respondents with an opinion prefer their chili with beans, compared to 22% who lean toward bean-free. Eleven percent, meanwhile, aren’t fans of either variation. These bean-filled-chili fans skew male and are more likely to be 45 or older. However, this is just the beginning of what sets fans of chili with beans apart from those who go bean-free.
Here are the bean-filled facts comparing Americans who prefer beans in their chili with those who don’t:
Cooking: Sixty-three percent of those who prefer chili with beans enjoy cooking, eight percentage points higher than those who prefer chili without beans who say the same.
Grocery Stores: Fans of chili with beans are 15 percentage points more likely than those who prefer chili without beans to say they do the majority of their grocery shopping at a local or regional grocery store chain.
Spending Habits: Seventy-three percent of those who prefer their chili with beans say that they are ‘very’ or ‘somewhat’ careful spenders, compared to 63% of those who prefer their chili without beans who say the same.
Seasonal Preferences: Nearly half (49%) of those who prefer chili with beans say that winter is their least favorite season. Just one-third of those who prefer their chili without beans agree.
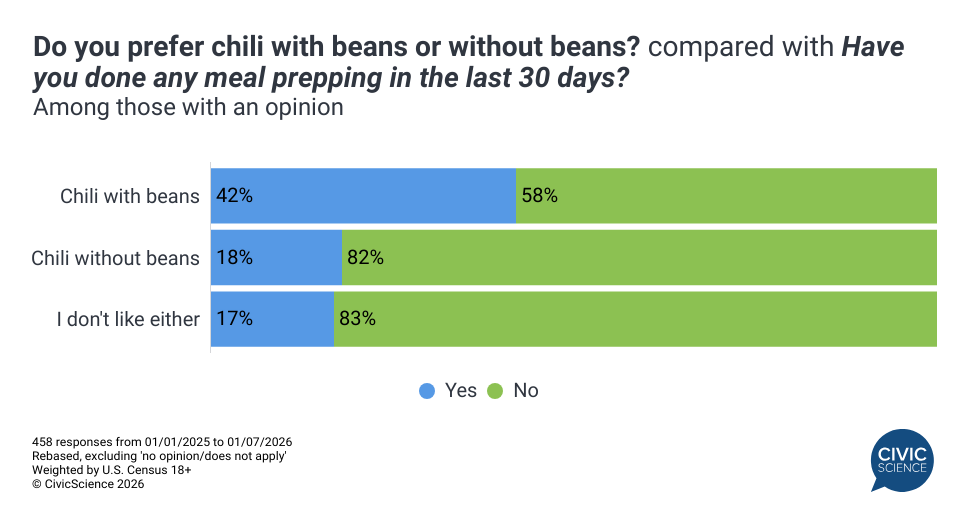
Meal Prep: Those who prefer chili with beans are more than twice as likely as those who prefer their chili without beans to say that they have meal prepped in the past 30 days (42% vs 17%).
Clearly, those who prefer chili with beans are more than just fans of the extra fiber. They’re intentional consumers when they shop and when they eat. And as a result, that bean-filled chili may be just what they need to slog through their least favorite season of the year.
Love taking polls? Sign up to participate in the Poll of the Day here.
This article’s data comes solely from CivicScience’s database, which contains nearly 700,000 poll questions and 5 billion consumer insights.