
When autumn arrives, Americans face a delicious dilemma: Are you team apple or team pumpkin? The data reveal it’s surprisingly close, with apple edging out pumpkin 26% to 23%. But perhaps most telling is that 35% of Americans refuse to choose sides, answering, “Why not both?”—suggesting that for many, fall isn’t about picking favorites but embracing the full seasonal bounty. Meanwhile, 16% are opposed to both and said neither one is for them.
This seemingly simple preference reveals fascinating patterns that extend far beyon produce aisles and coffee shops:
When autumn arrives, Americans face a delicious dilemma: are you team apple or team pumpkin? The data reveal it’s surprisingly close, with apple edging out pumpkin 26% to 23%. But perhaps most telling is that 35% of Americans refuse to choose sides, answering “why not both?”—suggesting that for many, fall isn’t about picking favorites but embracing the full seasonal bounty.
This seemingly simple preference reveals fascinating patterns that extend far beyond the produce aisle:
Age Plays a Role: Young adults (18-29) are pumpkin’s biggest supporters at 39%, nearly matching their “why not both” preference at 44%. Meanwhile, older Americans increasingly embrace apple—those 30-44 show the strongest apple loyalty at 40%, while the 65+ crowd leads in the diplomatic “neither” category at 33%.
Gender Preferences: Women show stronger apple allegiance at 30% compared to men’s 22%, while men lean slightly more toward pumpkin (25% vs. women’s 21%). Notably, women are also more likely to choose “why not both” at 39%, suggesting they’re less willing to limit their fall flavor options.
Regional Flavors: The West Coast breaks every rule, with pumpkin dominating at 37%—the only region where it outpaces apple. The South shows the strongest apple preference at 37%, while the Northeast plays it safe with 33% choosing apple but an equal 26% refusing to pick sides with “neither.”
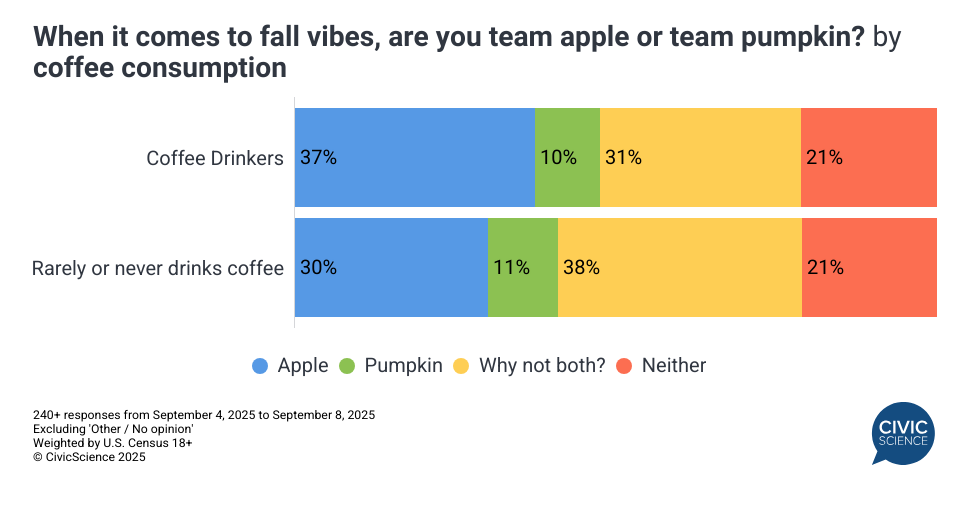
Coffee Culture Connection: Regular coffee drinkers surprisingly lean toward apple at 37%, defying expectations about pumpkin spice culture. Those who rarely drink coffee are more diplomatic, with 37% choosing “why not both”—perhaps they’re less influenced by seasonal coffee marketing.
The apple versus pumpkin divide isn’t just about taste—it’s a window into how Americans approach choice itself. While the flavors are nearly tied, the real story may be that over a third of people reject the premise entirely, preferring abundance over allegiance. In our polarized times, maybe “why not both?” is the most American answer of all.
Love taking polls? Sign up to participate in the Poll of the Day here.
This article’s data comes solely from CivicScience’s database, which contains nearly 700,000 poll questions and 5 billion consumer insights.