
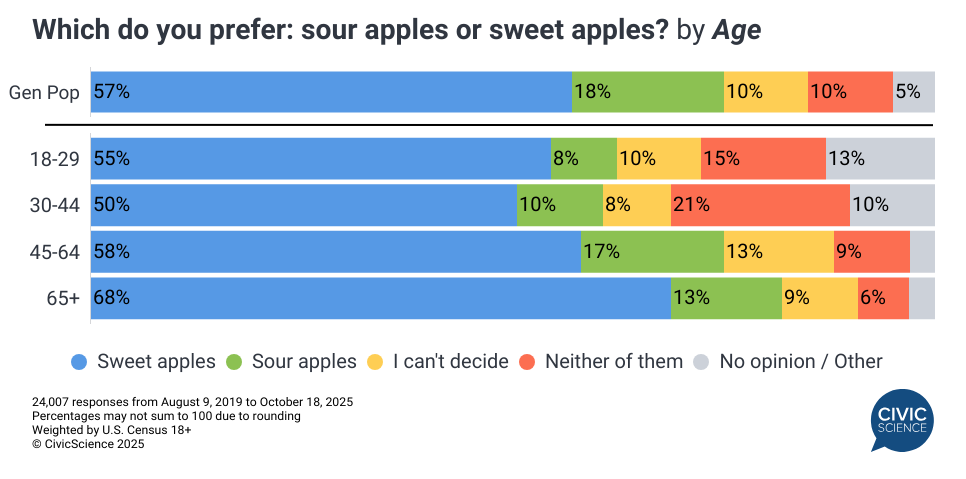
For National Apple Day, America’s apple preference is decisive: 57% prefer sweet apples while just 18% favor sour, with 10% unable to decide, 10% liking neither, and 5% having no opinion. This sweet-leaning majority holds across demographics but reveals interesting variations by age and surprising lifestyle patterns among those who buck the trend toward sweetness.
Young adults 18-29 show the least sweet preference at 55%, while seniors 65+ are most sweet-inclined at 68%. The sour contingent peaks among the youngest cohort at just 8% but rises to 17% for ages 45-64 before dropping to 13% for seniors. Interestingly, young adults are also most likely to reject apples entirely (15% choose “neither”) or remain undecided (10%). Gender differences are minimal—both men and women show 13% sour preference, though women are slightly more likely to be undecided (13% vs 9%).
But when we isolate just those with clear preferences (sour vs sweet, excluding other options), lifestyle differences emerge sharply:
- Temperature Tolerance: Sweet apple fans keep their homes warmer in winter—33% maintain 65-69°F versus 27% of sour lovers. Meanwhile, sour apple enthusiasts are more likely to keep things cooler at 60-64°F (10% vs 8%).
- Social Media Susceptibility: Sour apple lovers are far more influenced by social media when shopping—13% say friends and contacts influence their purchases “a lot” compared to just 5% of sweet apple fans. This suggests sour preference might correlate with trend-seeking behavior.
- Digital Shopping: Among tablet owners, sour apple fans shop on their devices more frequently—33% make purchases “very frequently or often” versus 23% of sweet apple lovers, reinforcing their digital-forward tendencies.
- Beverage Preferences: Sweet apple fans unsurprisingly favor Pepsi more (45% favorable vs 37% for sour lovers), aligning their fruit and soda preferences toward sweeter profiles.
- Music Habits: Both groups show similar streaming patterns, though sour fans are slightly less likely to avoid music entirely (41% listen zero hours vs 47% of sweet fans).
Sour apple enthusiasts emerge as a distinct minority—more digitally influenced, cooler-temperature preferring, and frequent online shoppers who embrace tartness across their consumption choices. Sweet apple lovers represent the mainstream, preferring warmth, sweetness, and traditional shopping patterns. In the apple aisle, we’re not just choosing fruit—we’re revealing whether we seek comfort or edge, tradition or trend, sweet stability or sour adventure.
Love taking polls? Sign up to participate in the Poll of the Day here.
This article’s data comes solely from CivicScience’s database, which contains nearly 700,000 poll questions and 5 billion consumer insights.