
In the battle of liquid comfort foods, Americans clearly have a favorite. Among those with an opinion on the soup versus stew debate, stew takes the crown at 56% while soup garners 44%. But this 12-point gap reveals fascinating patterns about age, gender, work style, and lifestyle choices that extend far beyond the dinner bowl.
Gen Z adults (18-29) dramatically favor soup at 61% versus stew’s 39%—a massive 22-point gap that flips the national preference. But this trend reverses with age: the 30-44 group splits evenly at 50-50, while older Americans increasingly embrace stew. Those 45-64 prefer stew at 55%, and seniors 65+ choose stew at 60%. This suggests younger Americans may prefer lighter, quicker meals while older generations gravitate toward heartier, more substantial fare.
Women show a striking preference for soup at 51% compared to men’s 35%. Meanwhile, men overwhelmingly choose stew at 65% versus women’s 49%. This substantial difference hints that men may prefer more filling, meat-heavy dishes while women lean toward lighter options.
Hybrid workers show the strongest soup preference at 57%, while fully remote workers heavily favor stew at 60%. In-person workers fall in between but still lean stew at 51%. This counterintuitive finding suggests that those working from home may prefer heartier, more substantial meals, while hybrid workers might favor quicker, lighter options during their varied schedules.
But there’s much more to explore beyond demographic data:
Culinary Adventurousness: Soup lovers are notably more adventurous eaters, with 40% saying they “usually keep up with what’s happening” in food trends compared to just 36% of stew fans. Meanwhile, stew enthusiasts are more likely to stick with what they know at 50% versus soup lovers’ 46%—a pattern suggesting soup preference correlates with culinary curiosity.
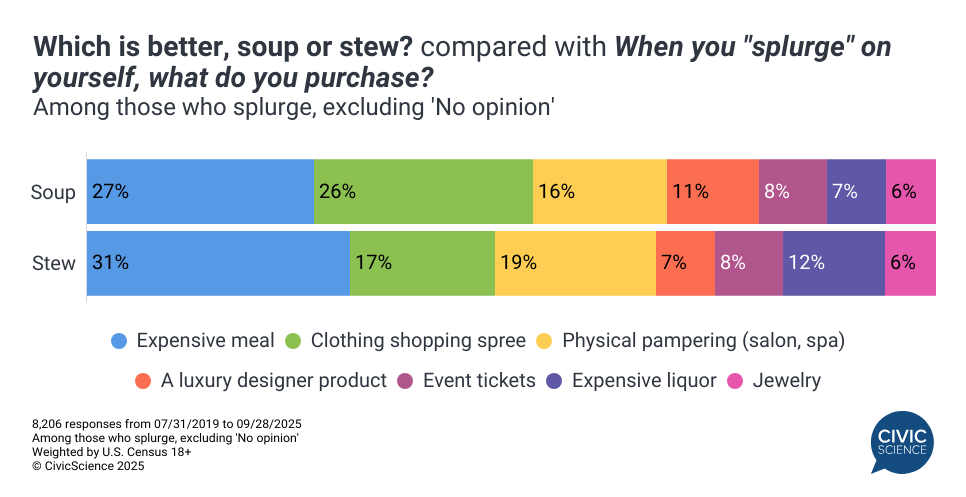
Splurge Psychology: When treating themselves, soup and stew lovers show distinct spending patterns. Soup fans lead in clothing splurges at 26% versus stew’s 17%, while stew lovers prefer expensive meals at 31% compared to soup’s 27%. This 9-point clothing gap and 4-point dining difference suggest soup lovers may prioritize appearance-based treats while stew fans focus on food experiences.
Media Consumption: Soup enthusiasts are significantly more likely to listen to radio frequently at 63% compared to stew lovers’ 55%—an 8-point gap that hints at different media consumption patterns and possibly commuting habits.
The soup versus stew divide isn’t just about thickness—it’s a window into generational shifts, gender preferences, and lifestyle priorities. Soup represents the lighter, faster-paced preferences of younger, more adventurous consumers, while stew embodies the hearty, traditional values of older, more settled Americans. In a world where food choices increasingly define identity, even this simple preference reveals deep truths about how we approach comfort, convenience, and culinary tradition.
Love taking polls? Sign up to participate in the Poll of the Day here.
This article’s data comes solely from CivicScience’s database, which contains nearly 700,000 poll questions and 5 billion consumer insights.