It’s that time of year, Girl Scout cookies are on sale, which begs the question: Which are Americans’ favorite, and what does their cookie preference say about them?
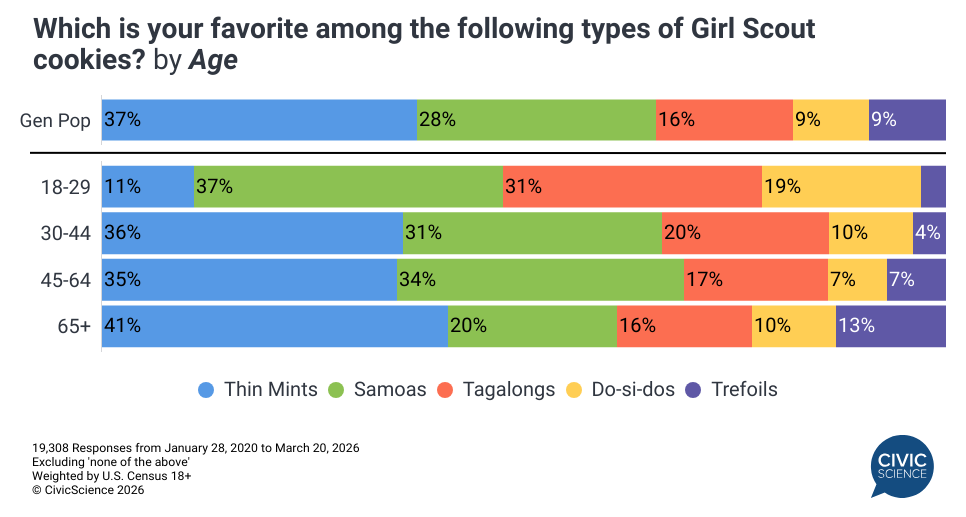
Among the cookies studied, the latest CivicScience survey data show that Thin Mints lead among U.S. adults (excluding ‘none of the above’). However, cookie preferences vary dramatically by age: just 11% of those aged 18-29 favor Thin Mints, compared to 41% of respondents aged 65+. Instead, Gen Z’s are most likely to prefer Samoas or Tagalongs. Men and women are nearly equally as likely to prefer Thin Mints (35% to 38%, respectively), but men are slightly more likely to say Tagalongs and Do-si-dos are their favorite. Women are more likely to enjoy Trefoils.
Consumer-reported data allows us to explore beyond surface-level demographics. Here’s a look at how Americans stand out based on their Girl Scout cookie preference:
- Indulging their sweet tooth: When asked how often Girl Scout cookie fans indulge their sweet tooth, those who favor Thin Mints are most likely to say ‘all the time’ (34%), followed by fans of Trefoils and Samoas (29%, each). Those who most prefer Tagalongs, meanwhile, are most likely to say they indulge in sweets ‘here and there’ (56%).
- Cupcakes vs. brownies: In a battle of other desserts, brownies are the consensus leader over cupcakes, regardless of the type of Girl Scout cookie Americans prefer. That said, consumers who most enjoy Trefoils are at least 10 points more likely to favor cupcakes over brownies. Those who say Tagalongs are their favorite Girl Scout cookie are the most likely to prefer brownies over cupcakes.
- Zip-up hoodies vs. pullovers: Samoas fans, followed closely by Trefoils lovers lead the way in preferring zip-up hoodies over pullovers. Those who most love Thin Mints, meanwhile, lead the pack in their preference for pullover hoodies. Tagalongs fans are the most open to both, as they lead in feeling ‘they both have their merits.’
- Listening to music on YouTube: Tagalongs fans are the most likely to say they listen to music on YouTube with any frequency and are most likely to say they listen to more than five hours per week (32%), outpacing the next closest cookie fans (Do-si-dos) in this regard by eight points. On the other hand, Trefoils fans are the least likely to listen to music on YouTube in an average week, with 50% saying they never do this. Samoas enjoyers lead the way in turning to YouTube for music between 1-5 hours per week (38%).
- Brand vs. price when shopping: When they’re shopping in general, those who love Tagalongs are the most likely to say brand is most important to them, while Samoas lovers are most likely to say price is most important to them. Trefoils fans, meanwhile, lead the way in reporting that brand and price are ‘equally important.’
- Word of Mouth: When they are happy with a product, Trefoils fans (48%) and Thin Mints (45%) lovers lead in being ‘very’ likely to tell friends and family about that product. Just under 2 in 5 (38%) of those who love Samoas say the same, the lowest such percentage across the Girl Scout cookie varieties studied.
Where do you stand? Take this poll now and see how you compare:
Whether you’re a “cupcake person” or a “brownie person,” your Girl Scout cookie of choice reveals a great deal about your daily life — from your preferred style of hoodie to your weekly music streaming habits. Across brand loyalty, social sharing, and snacking rituals, the patterns found among different cookie enthusiasts suggest that your favorite box isn’t just a pantry staple, but a reflection of your unique consumer identity and how you navigate the marketplace.
Love taking polls? Sign up to participate in the Poll of the Day here.
This article’s data comes solely from CivicScience’s database, which contains nearly 700,000 poll questions and 5 billion consumer insights.