
Coffee or tea? It’s a question that divides Americans, and new CivicScience polling reveals some fascinating patterns behind our beverage preferences. Among U.S. adults surveyed from January 2024 to July 2025, coffee takes the clear lead with 65% choosing it over tea’s 35%.
Where do you fit in? Let us know: Pick one: coffee or tea?
But dig deeper, and the demographics tell a compelling story. Age plays a major role in this caffeinated divide—younger Americans are evenly split between coffee and tea (50/50 for ages 18-29), while older generations increasingly favor tea. Among those 65 and older, a striking 73% prefer tea over coffee, suggesting our taste buds may mellow with age.
The workplace connection is equally intriguing. Those working fully in-person show the strongest coffee preference at 69%, compared to just 31% choosing tea. Remote workers, however, are more balanced in their preferences (56% coffee, 44% tea), while hybrid workers actually lean toward tea (60% tea vs. 40% coffee). Perhaps the home environment makes tea more appealing, or maybe remote work culture has shifted our beverage habits.
But demographics aren’t the only indicators when it comes to beverage preference:
Netflix habits: Coffee drinkers are heavy streamers—59% watch Netflix several times a week, compared to just 38% of tea drinkers. Tea lovers are more likely to be occasional viewers, with 47% watching only a few times a month.
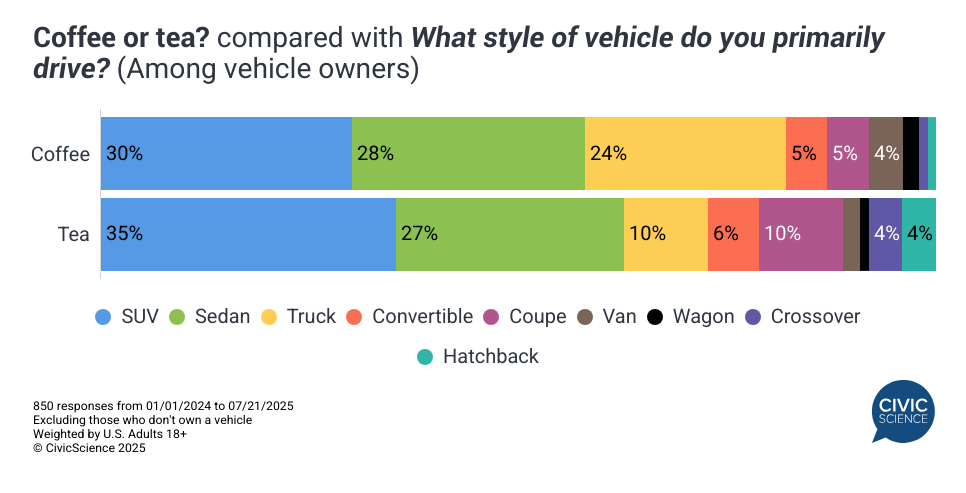
Vehicle choice: Tea drinkers gravitate toward SUVs (35% vs. 30% for coffee drinkers) and are more likely to drive trucks (10% vs. 24% for coffee). Coffee drinkers show slightly more preference for sedans and convertibles.
Review habits: Tea drinkers are nearly twice as likely to use review services like Yelp weekly (29% vs. 16% for coffee drinkers), suggesting they may be more research-oriented consumers.
Your beverage choice may seem simple, but it’s connected to everything from your work setup to your streaming habits. While coffee dominates overall, the patterns suggest our drink preferences reflect broader lifestyle differences—and maybe reveal more about our daily routines than we realize.
Love taking polls? Sign up to participate in the Poll of the Day here.
This article’s data comes solely from CivicScience’s database, which contains nearly 700,000 poll questions and 5 billion consumer insights.