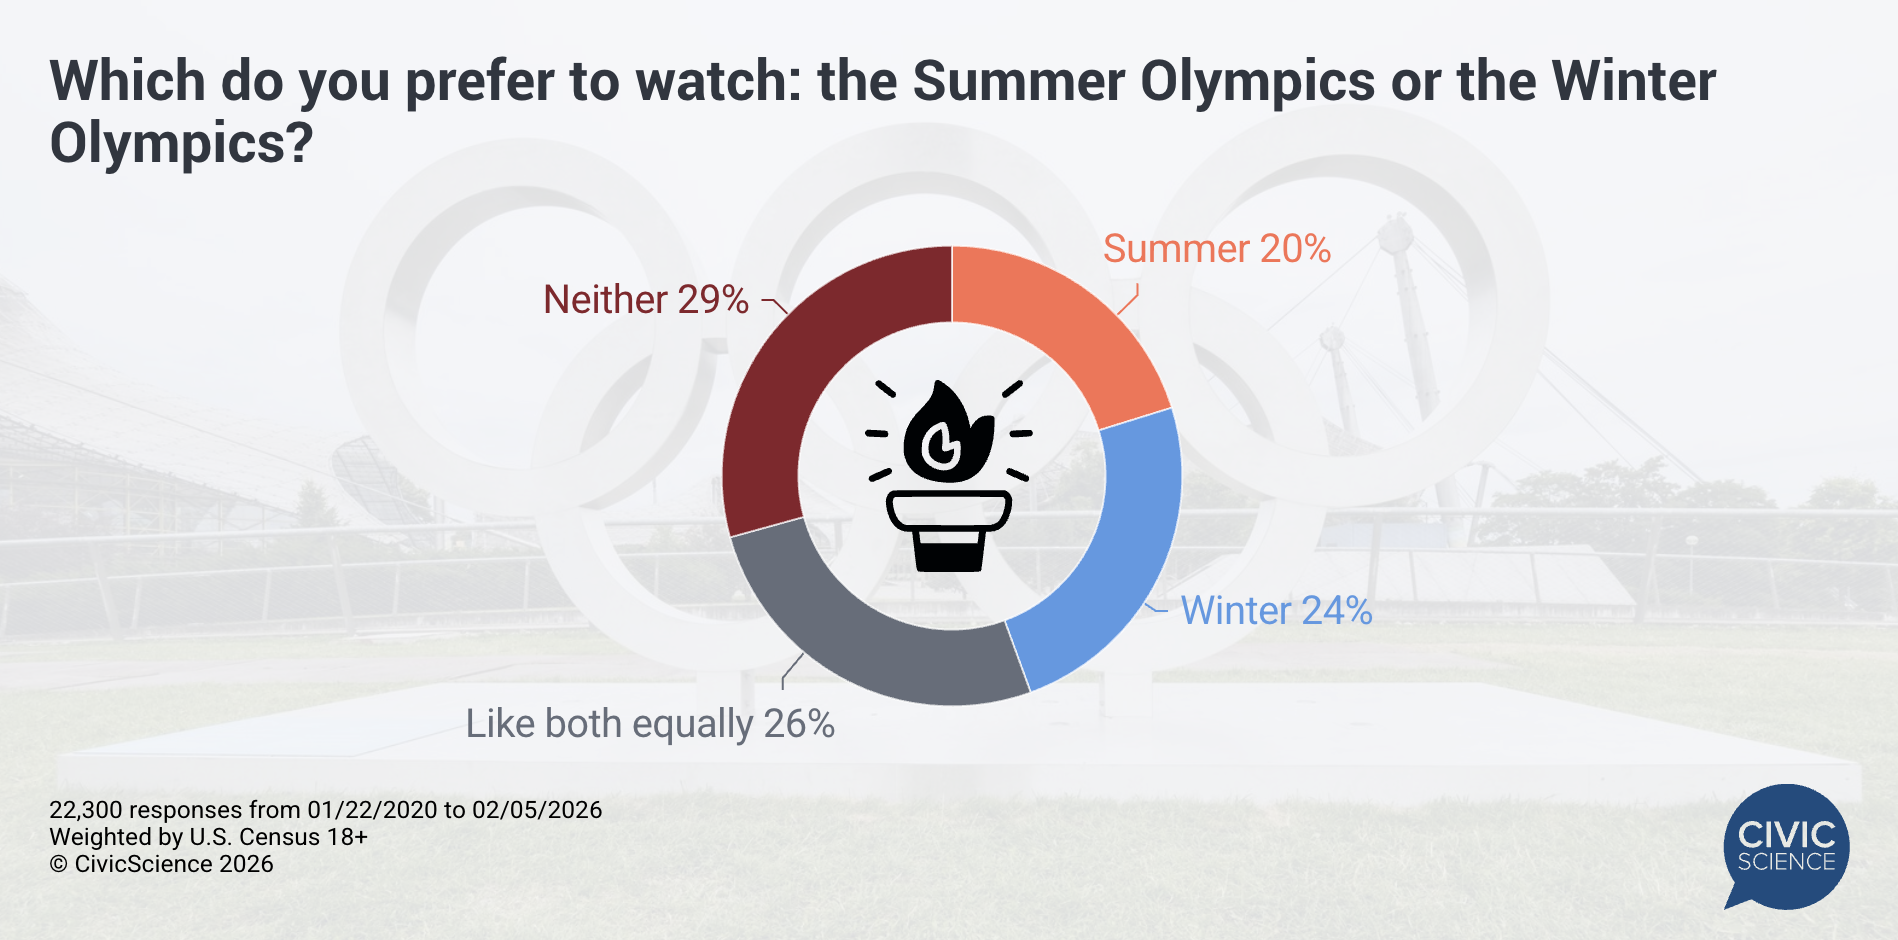
With the Winter Olympics kicking off on February 6, Americans are once again choosing sides—not just between athletes, but between seasons. According to an ongoing CivicScience poll of more than 20K respondents dating back to 2020, preferences are fairly evenly split. Twenty percent say they prefer the Summer Olympics, 24% favor the Winter Games, 26% like both equally, and 29% say they’re not really a fan of either.
Looking only at those who enjoy watching any of the games, younger adults tend to have stronger opinions. Gen Z and Millennials are more likely to pick a side, while Gen X and Baby Boomers are most likely to say they enjoy both equally. Men also tend to have stronger preferences, whereas nearly half of women say they like the Summer and Winter Olympics about the same. Income plays a role as well, with adults in middle- and high-income households more likely to report a clear favorite. Geography adds another layer: suburban residents lean toward the Summer Olympics, while those living in cities and rural areas are more likely to say they prefer the Winter Games if forced to choose.
But demographics aren’t the only thing separating Summer and Winter Olympics fans. CivicScience data reveal several lifestyle and preference differences between the two groups:
- College vs. Pro Sports: Those who prefer the Summer Olympics are most likely to say they favor college sports, while Winter Olympics fans lean more toward professional sports.
- Watching vs. Playing Sports: Summer Olympics fans lead in watching sports, outpacing Winter Olympics fans by 14 points. Winter Olympics fans, however, are six points more likely to say they prefer playing sports.
- Food Cravings: While sweet cravings dominate for both groups, Summer Olympics fans are more likely to prefer sweet foods overall. Winter Olympics fans are six points more likely to say they favor savory cravings.
- Grilling Habits: Seasonal associations show up clearly—those who prefer the Summer Olympics are seven points more likely to say they grill as much as possible during the summer months (26% vs. 19%).
Whether it’s snow-covered slopes or sun-soaked stadiums, Olympic preferences reflect more than just sports—they connect to how Americans eat, watch, play, and spend their free time. As the Winter Games return, the data suggest that while many enjoy both, those who pick a favorite often bring distinct habits and tastes with them.
Love taking polls? Sign up to participate in the Poll of the Day here.
This article’s data comes solely from CivicScience’s database, which contains nearly 700,000 poll questions and 5 billion consumer insights.