")
Americans have strong feelings about grocery shopping, and they’re nearly split down the middle (among those who either ‘love’ or ‘hate’ it. CivicScience data from almost 10,000 respondents reveals that 51% love grocery shopping while 49% hate it—making this one of the most evenly divided everyday activities in American life.
Vote Now: Your Opinion Matters

Tell us: How do you feel about grocery shopping?
The grocery shopping divide follows some clear demographic patterns. Generation plays a major role: younger Americans ages 18-29 overwhelmingly hate grocery shopping (62%), while every older age group leans toward loving it. The biggest grocery enthusiasts are those ages 30-44, where 59% express love for the activity. Seniors 65+ show a solid 55% love rate, suggesting that grocery shopping appreciation generally grows with age and life experience.
Gender creates an even starker division. Men love grocery shopping at 61% versus women at just 44%—a 17-point gap that represents one of the largest gender differences in everyday activity preferences. This could reflect different roles in household management or varying approaches to the shopping experience itself.
How people feel about grocery shopping connects to several broader lifestyle patterns:
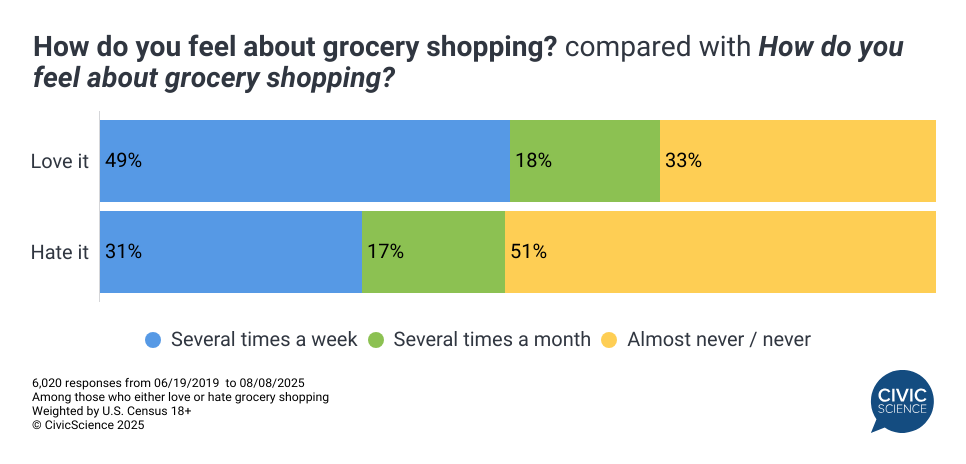
Fitness habits: Grocery lovers are significantly more active, with 49% exercising several times a week compared to just 31% of grocery haters. This could suggest that those who enjoy grocery shopping are more invested in healthy eating and overall wellness routines.
Spending control: There’s a clear relationship between grocery attitudes and financial discipline. Grocery lovers are much more likely to be careful spenders (71% vs. 61%), while grocery haters struggle more with spending control—17% report difficulty controlling spending versus only 13% of those who love shopping.
YouTube consumption: Grocery haters are heavier digital consumers, with 33% using YouTube rarely or never compared to 26% of grocery lovers. Those who enjoy grocery shopping are more likely to be daily YouTube users (40% vs. 26%), suggesting different media consumption patterns.