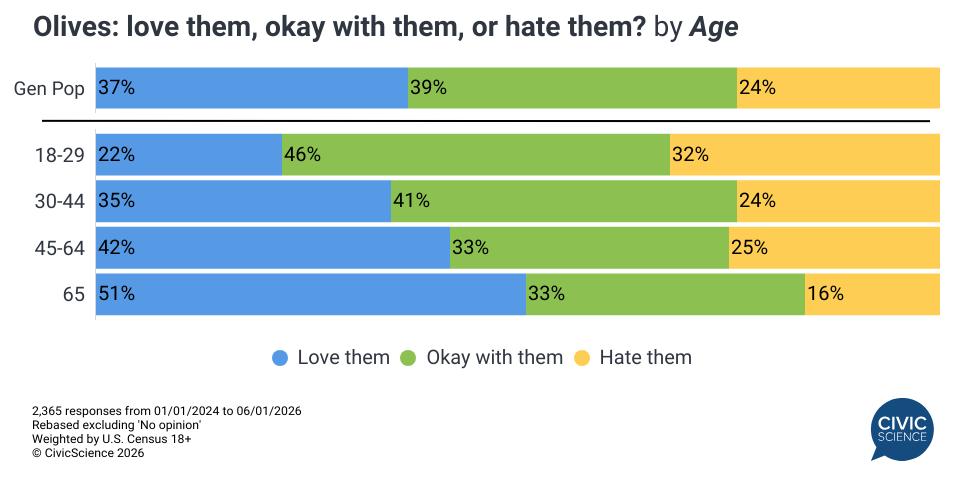
In honor of National Olive Day, CivicScience asked Americans how they really feel about olives. Among those with an opinion, 37% say they love them, 39% are okay with them, and 24% actively hate them. Data among Americans overall is noteworthy enough on its own, but it becomes even more compelling when examining through the lens of olive lovers and olive haters and how they differ across a range of other habits and preferences.
Age is the clearest dividing line. Just 22% of adults 18 to 29 say they ‘love’ olives, compared to 51% of adults 65 and older. The youngest cohort is also the most likely to land in the middle, with 46% saying they are okay with them. Olive enthusiasm, it seems, is something many Americans grow into.
What Olive Opinions Reveal About Lifestyle Habits and Traits
CivicScience cross-referenced olive opinions with a range of other questions. The comparisons below focus on those who love olives versus those who hate them.
Favorite chicken sandwich toppings: Olive lovers and haters agree that a chicken sandwich needs a sauce, but they disagree on which one. Nearly half of olive lovers (47%) say mayo is their go-to chicken sandwich topping, compared to 33% of haters. Haters are much more likely to reach for barbecue sauce (18% vs. 11%) or cheese (12% vs. 6%).
Best dipping sauce for fries: Olive lovers are loyal ketchup people, with 61% naming it as their top fry dipping sauce. Among haters, that number drops to 45%, and preferences spread more widely across honey mustard (15%), ranch (15%), and BBQ sauce (14%).
Cooking sentiment: Olive lovers are far more likely to enjoy cooking, with 69% saying they love or like it, compared to just 49% of haters. Haters are significantly more likely to feel neutral about cooking (28% vs. 16%) or say they actively dislike it (23% vs. 15%).
Morning vs. night productivity: Olive lovers tend to be morning people, with 67% saying they do their best work before noon, compared to 55% of haters. Haters are more likely to say they are at their best at night (45% vs. 33%).
Running and jogging: Despite olive lovers being more enthusiastic cooks, haters are actually more likely to run or jog regularly, with 28% doing so weekly compared to 23% of lovers. Olive lovers are more likely to rarely or never run at all (71% vs. 58%).
Book format: Olive lovers read printed books more often, with 43% preferring new print editions and 34% opting for used print. Haters are more likely to go digital, with 31% reading primarily via ebook compared to 19% of lovers.
Where do you stand? Take this poll now and see how your preference compares with other Americans:
Love taking polls? Sign up to receive topical polls straight to your inbox every day in The CivicScience Poll of the Day here.
This article’s data comes solely from CivicScience’s database, which contains nearly 700,000 poll questions and 5 billion consumer insights.